Echocardiographic evidence of aortic STENOSIS
Echocardiography Textbook
One dimensional Echocardiography
The examination must be done in the left parasternal position, on the long axis of the heart.
One-dimensional echocardiography will reveal changes in the structure and motion of the valve leaflets. There is a decrease in the amplitude of the systolic opening of the leaflets and their movement in one direction. It is worth noting that the hardening and thickening of the aortic valve also give us a similar picture even in the absence of hemodynamically significant stenosis, so a one-dimensional echocardiogram cannot be focused only on.
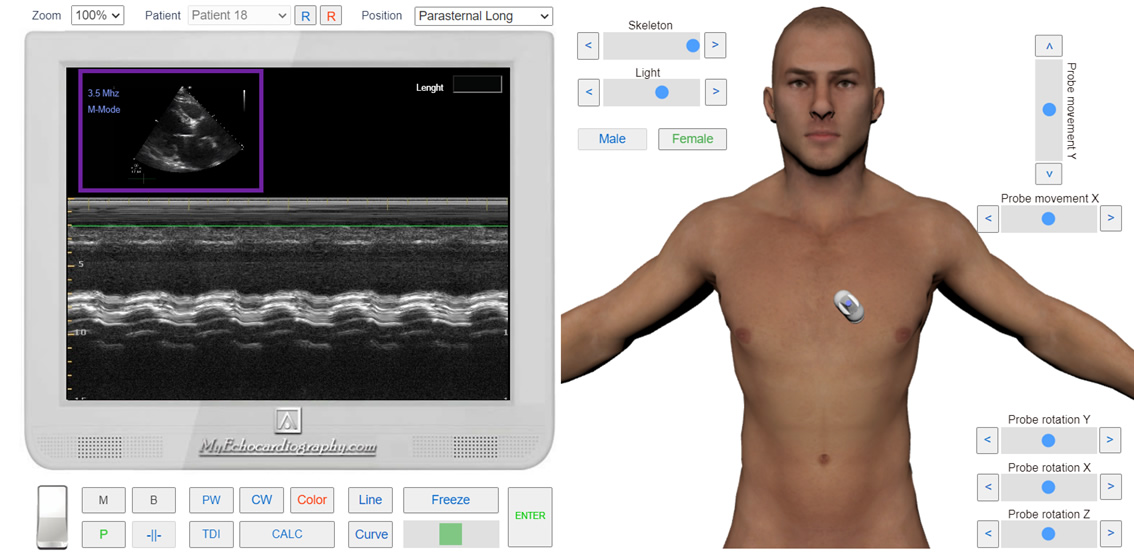
Left Parasternal View.The long axis. M-Mode. Aortic Stenosis. Simulation by Echocardiography Online Simulator MyEchocardiography.com
Two dimensional Echocardiography
A two-dimensional echocardiographic study should be performed on the short and long axis.
The number of leaflets, the amplitude of their movement (opening), thickness, and the presence of calcification should be evaluated.
A two-dimensional echocardiogram will reveal a decrease in the opening amplitude of the leaflets.
In the case of hemodynamically significant stenosis, such indirect signs as the post-stenotic expansion of the aorta, increase in the thickness and mass of the left ventricular wall, and increase in the size of the left atrium can be presented.
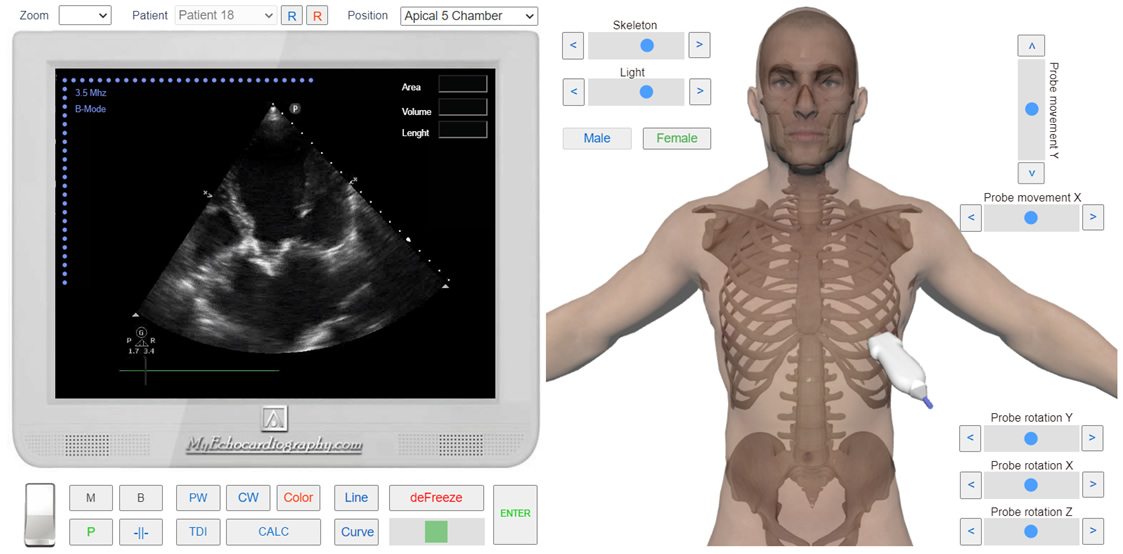
Apical 5 Chamber View. B-Mode. Aortic Stenosis. Simulation by Echocardiography Online Simulator MyEchocardiography.com
Spectral Doppler (PW, CW)
Continuous-wave and pulsed-wave spectral Doppler will reveal increased flow velocity beyond the aortic valve. Increased transaortic flow velocity is one of the most sensitive tests for aortic stenosis.
In spectral Doppler examination, the maximum flow velocity through the stenotic aortic valve is usually obtained from the apical five-chamber position. The ultrasound beam should be directed parallel to the stenotic flow.
The pressure gradient (pressure difference) between the left ventricle and the aorta is calculated using continuous wave Doppler.
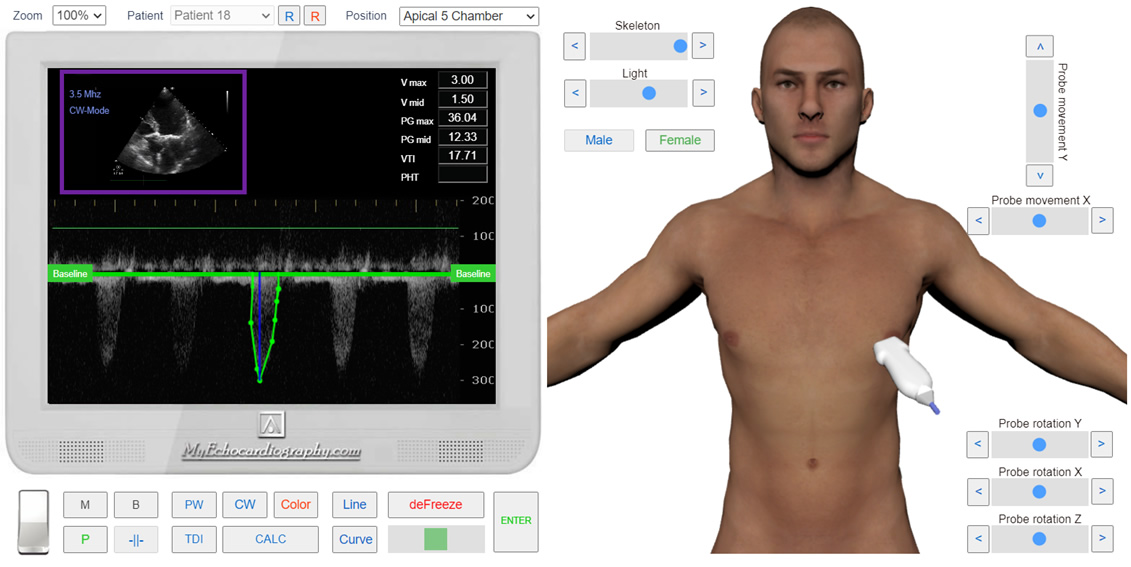
Apical 5 Chamber View. CW Doppler. Measurement of the Pic Velosity of the systolic flow and Mean pressure gradient. Aortic Stenosis. Simulation by Echocardiography Online Simulator MyEchocardiography.com
Methods of assessment severity of the Aortic Stenosis: